There are no items in your cart
Add More
Add More
| Item Details | Price | ||
|---|---|---|---|

Empowering you with Automation & Analytics for high-paying roles
7-day full refund · No questions asked · Built by an Ex-IBMer with 19 years of MNC experience
I am spending all my time extracting & cleaning data & preparing reports.
It's too hectic, and I always send my reports with no or little time to analyze & share insights.
Because of the last-minute rush, I am worried about errors & discrepancies, missing insights
My reports are complex with Vlookup & SUMIF. For every new scenario, I need to redo.
I know Excel, but I lack advanced MIS Reporting Skills like Automation & Analytics
I need to improve my MIS Skills and start a career in FP&A, Finance, or Reporting roles
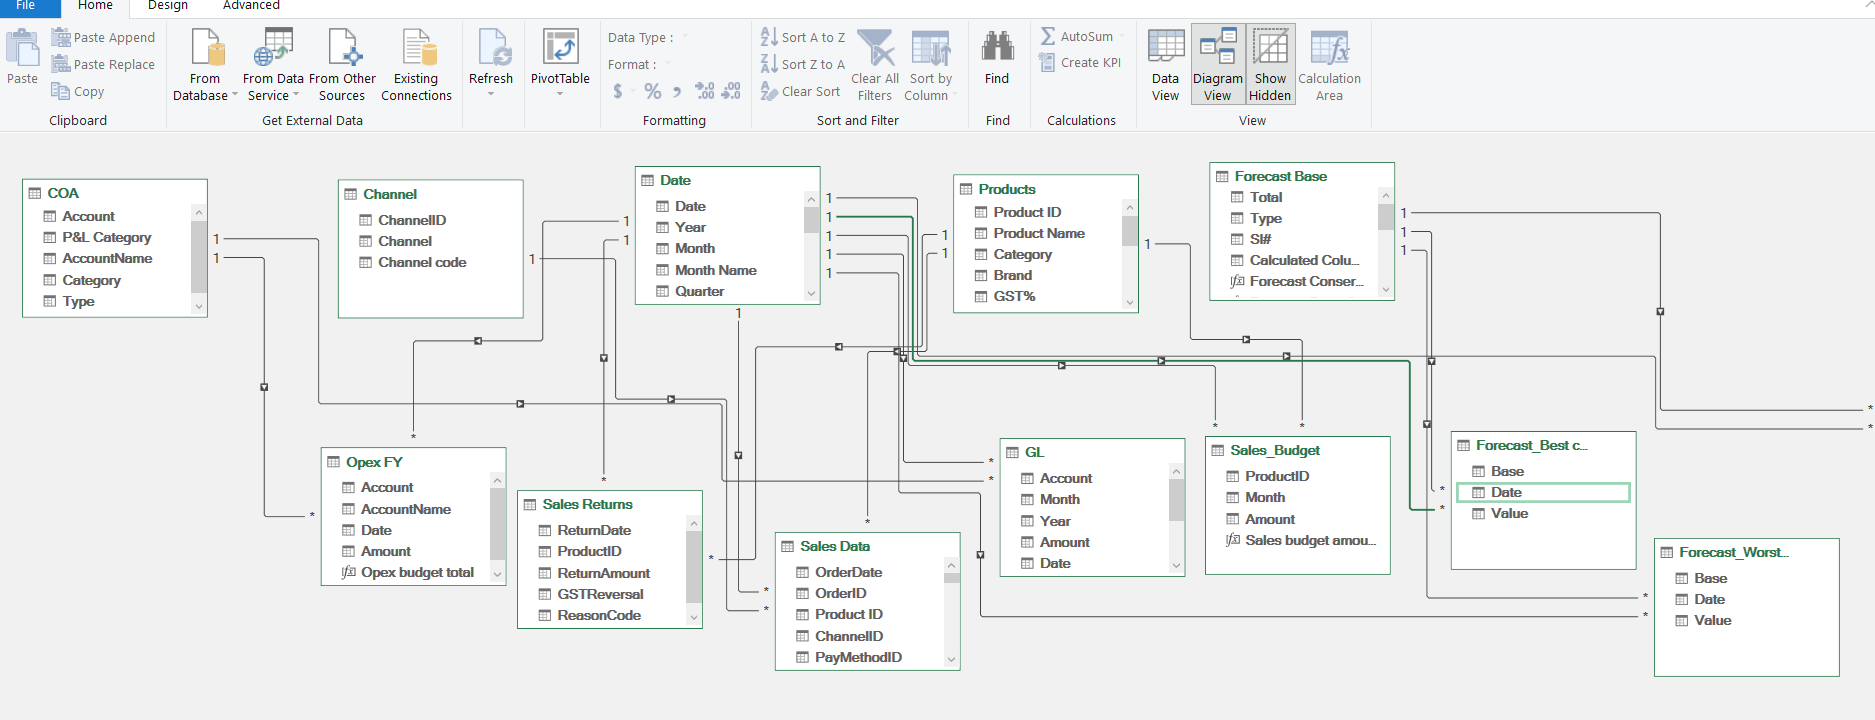
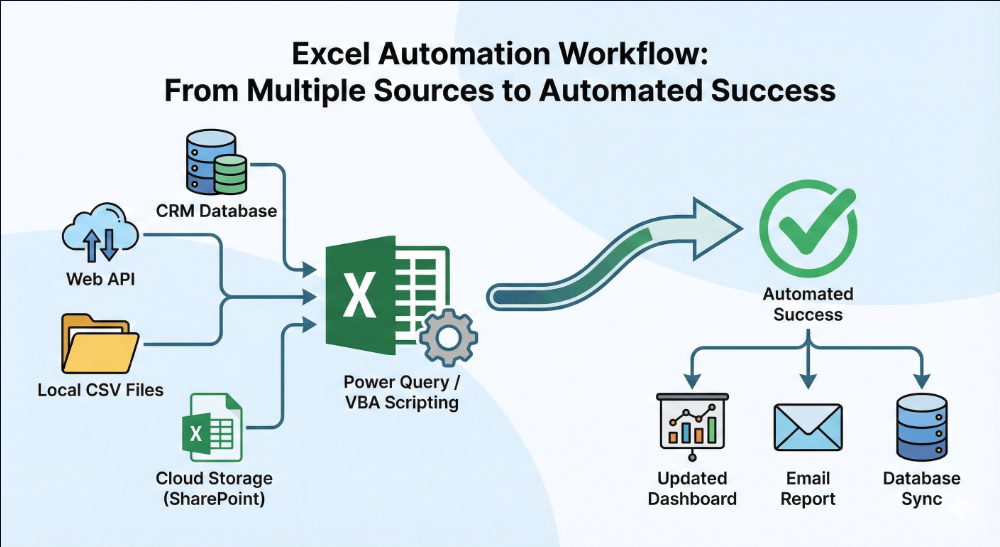
Move beyond simple spreadsheets. Master the tools that allow you to automate data flows and build robust data models.
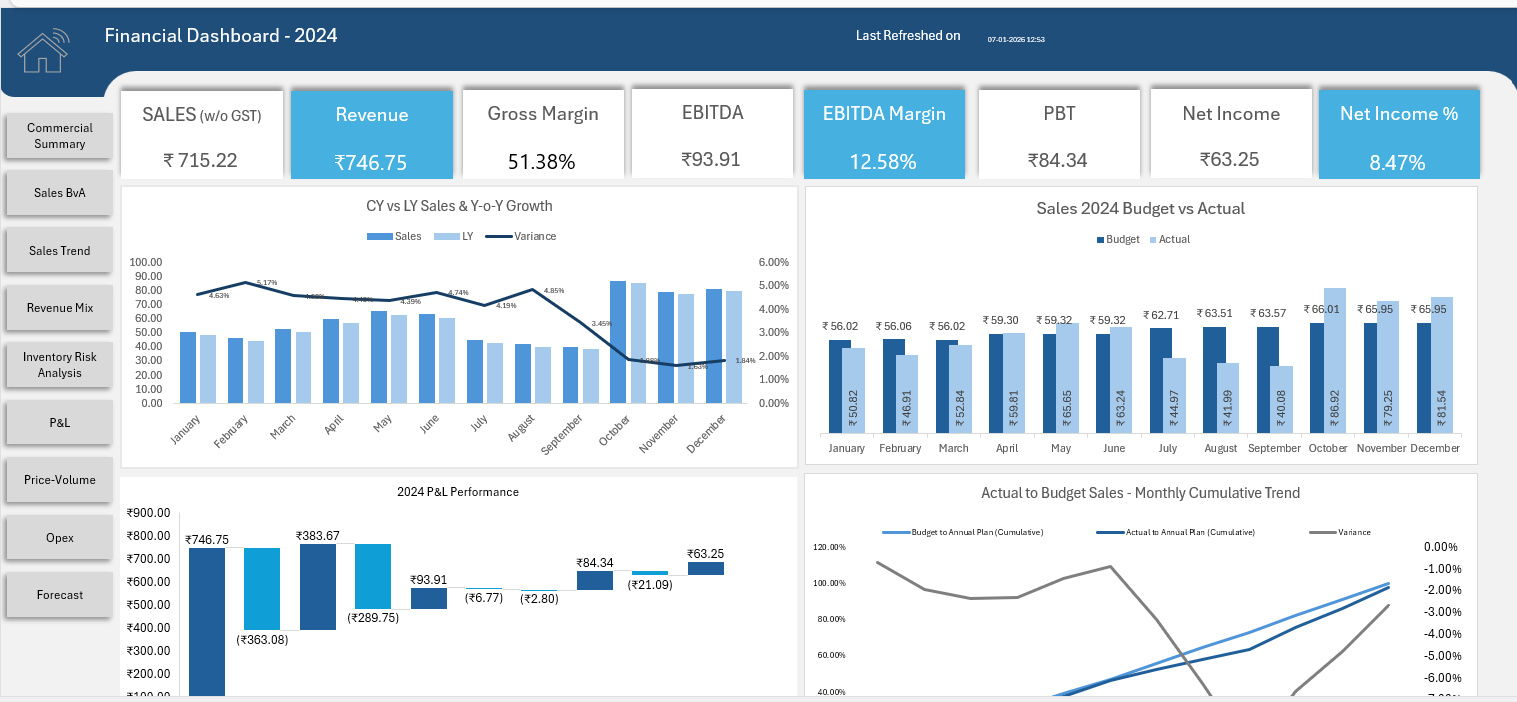
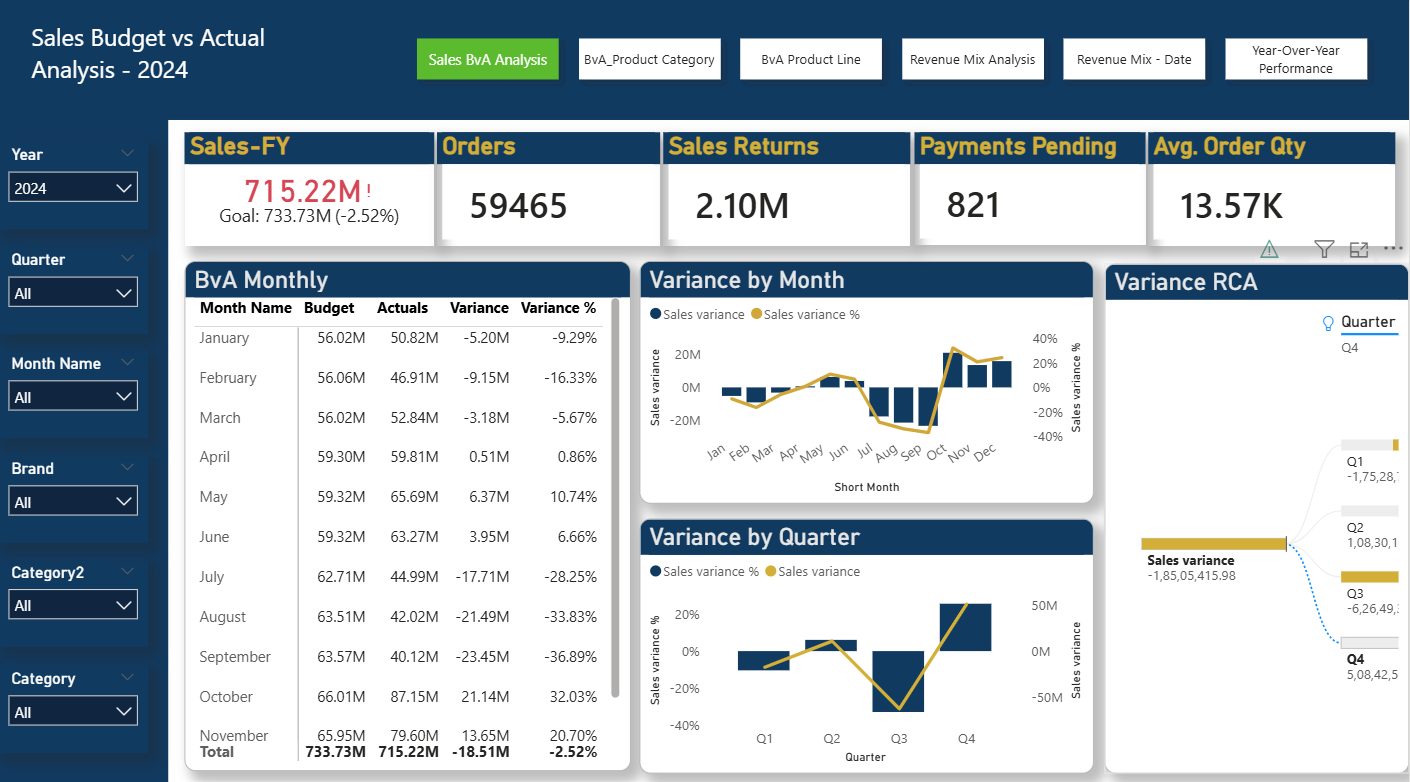
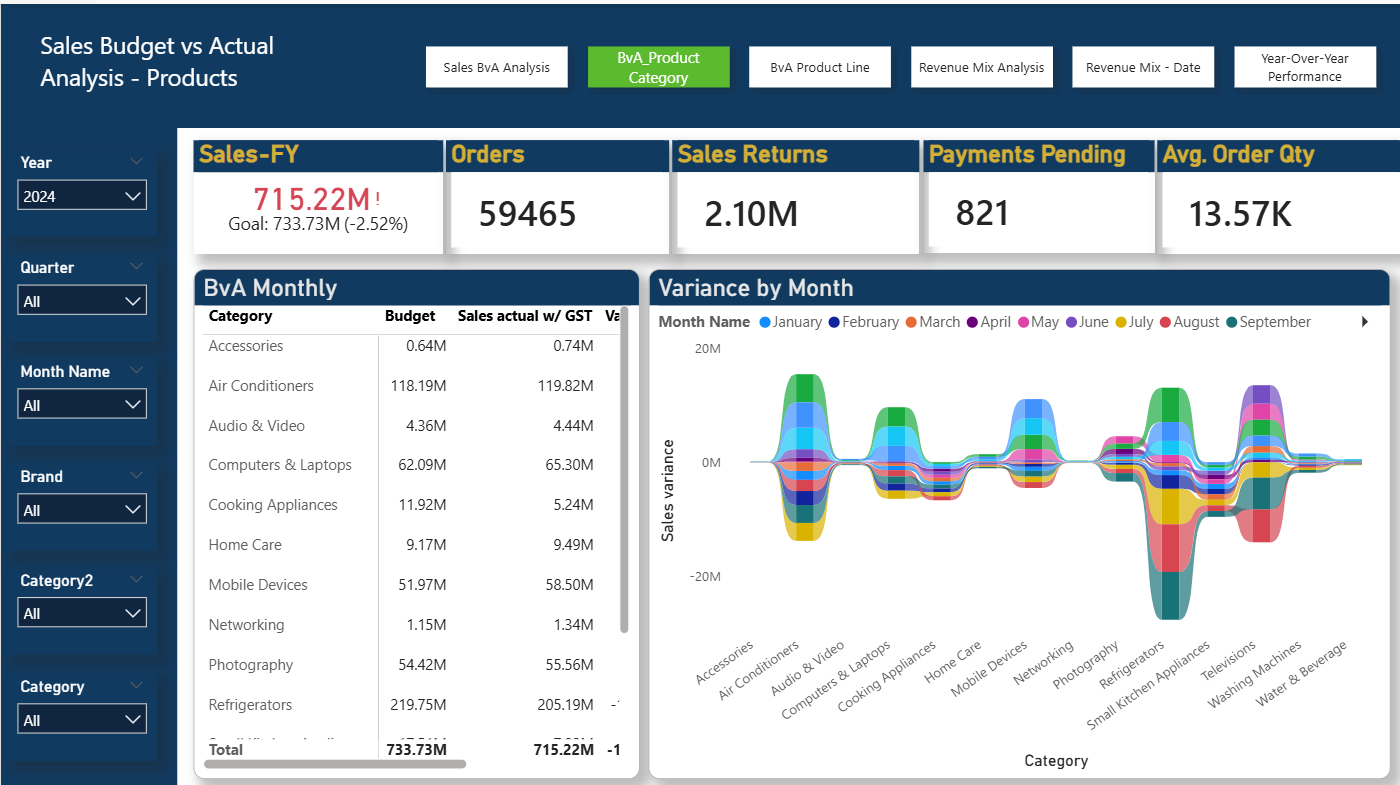
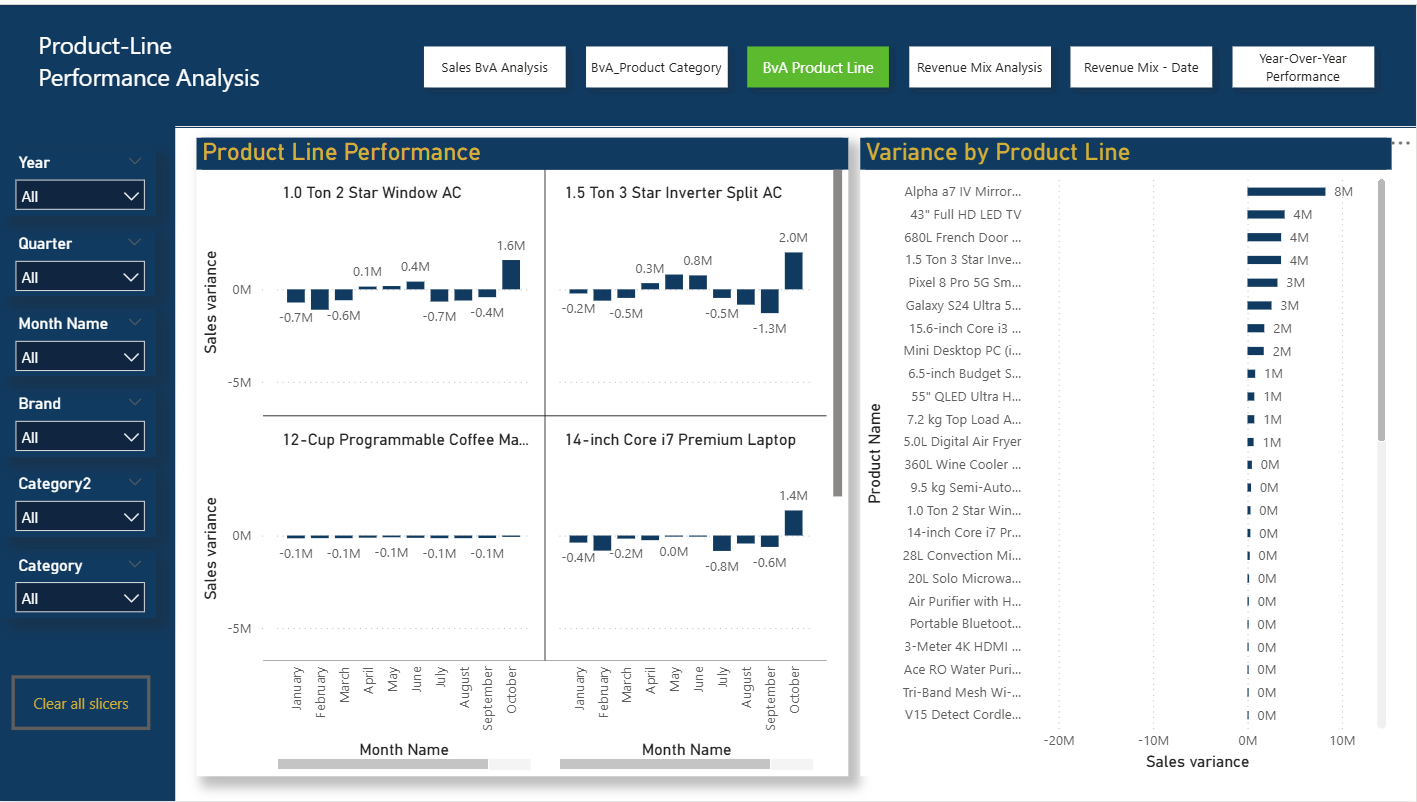
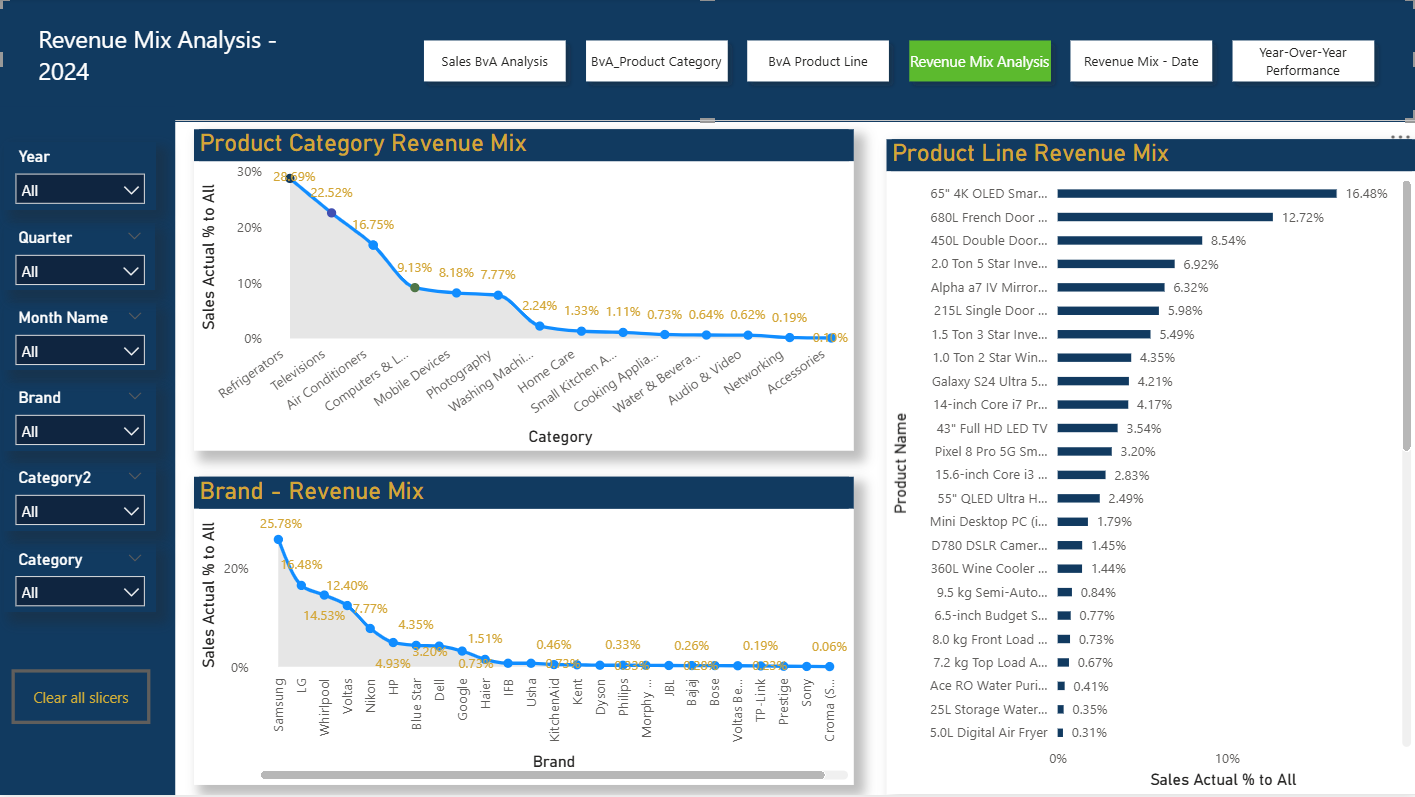
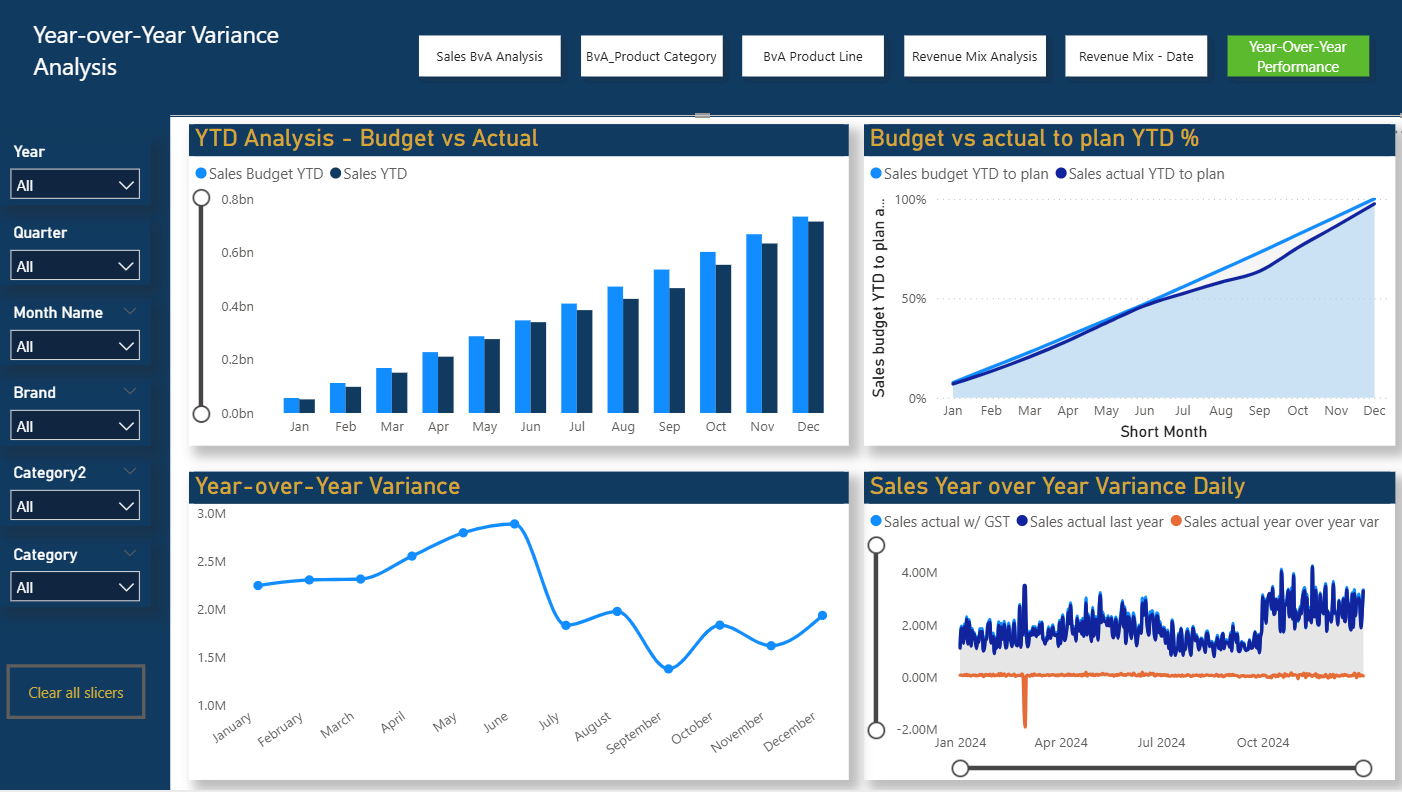
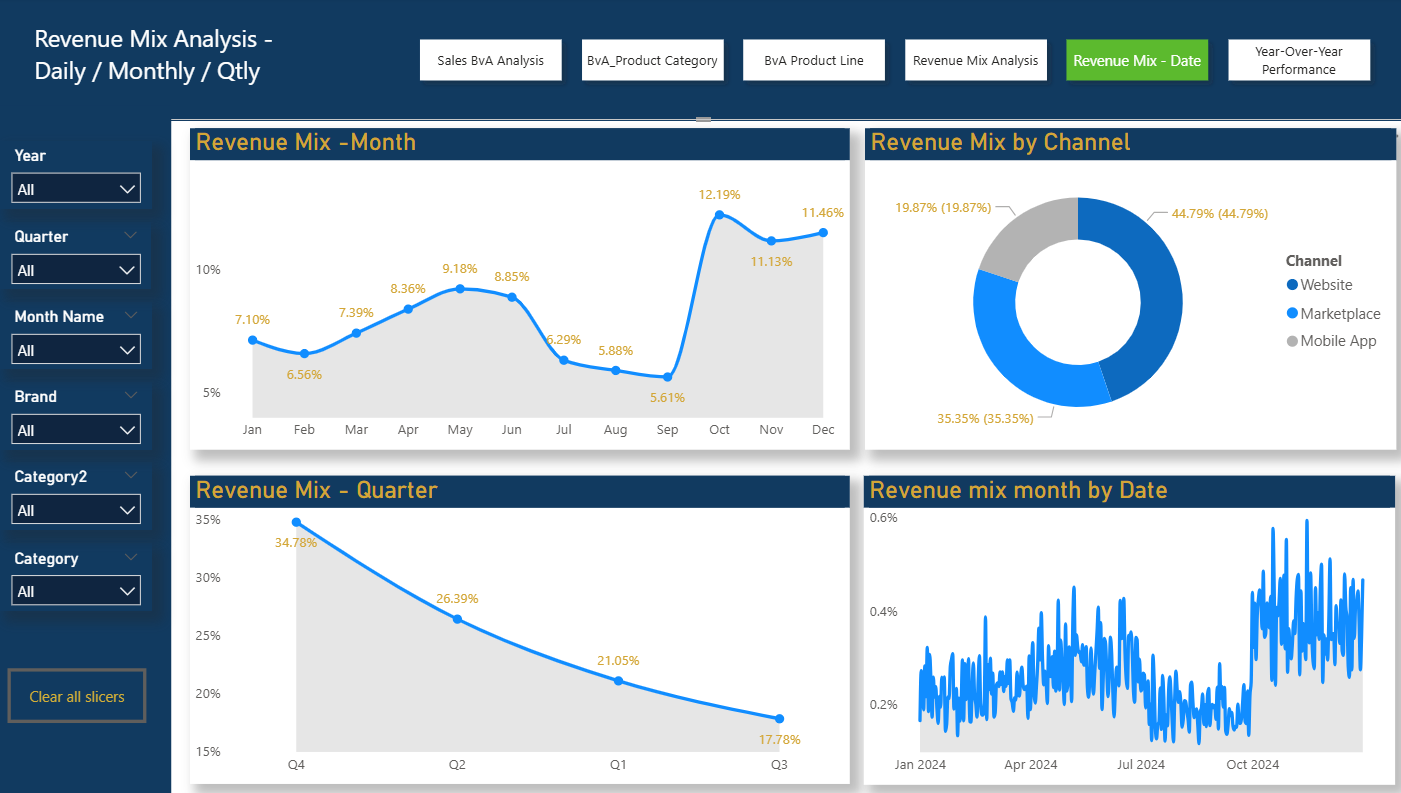
Turn raw financial data into interactive visuals your management actually understands. Tell the story behind the numbers.
Automation & Analytics Mastery in FP&A, Finance & Reporting
🛡️ 7-Day "Impact" Refund Guarantee Included
A level-by-level journey to mastering Finance Analytics.
Your toolkit to land the role you deserve.
Everything from Excel foundations to Advanced FP&A Automation in one comprehensive path.
Level 5 — MIS & FP&A Automation
Power Query · DAX · Advanced Modelling
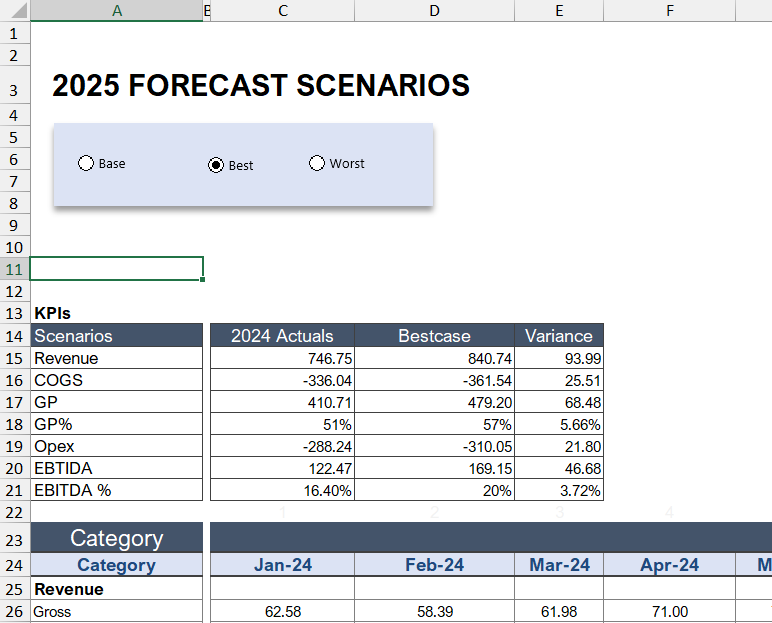
Level 4 — Financial Analysis
Forecasting · Scenarios · Goal Seek
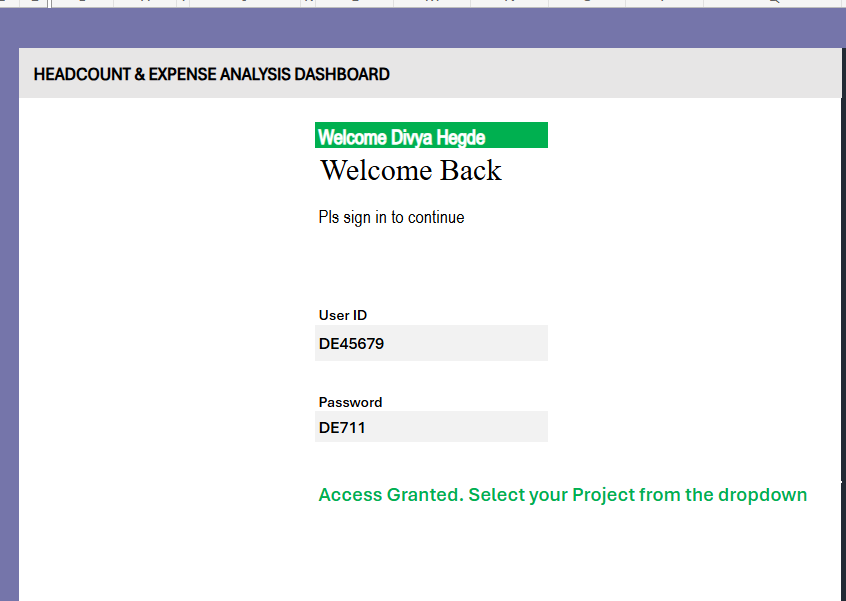
Level 3 — Dynamic Dashboards
KPI Tracking · Access Control · Visuals
Level 2 — Advanced Excel Projects
Lookup Challenges · Logic · Pivot Tables
Level 1 — Excel Basics
UI · Shortcuts · Data Handling
I have designed this course based on my 19-year career with IBM in Finance & Operations. It's not about learning Excel features; it's about mastering how to use these tools to solve high-stakes business problems.
Join my professional network of Finance Leaders and see the impact of these skills first-hand.
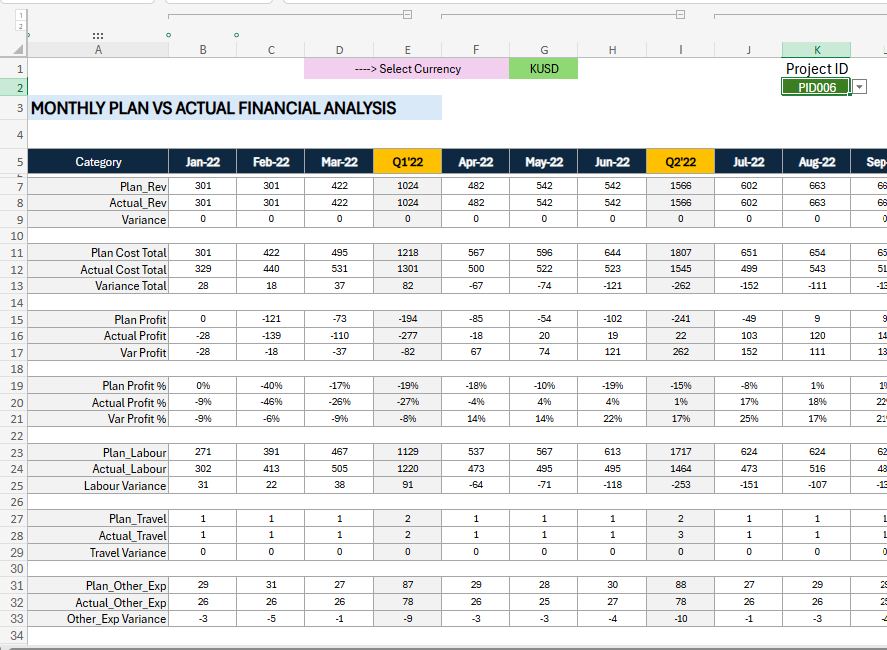
A 12-minute deep dive into the 6 mastery levels. See the automated reporting packs, the P&L structures, and exactly what you'll build.
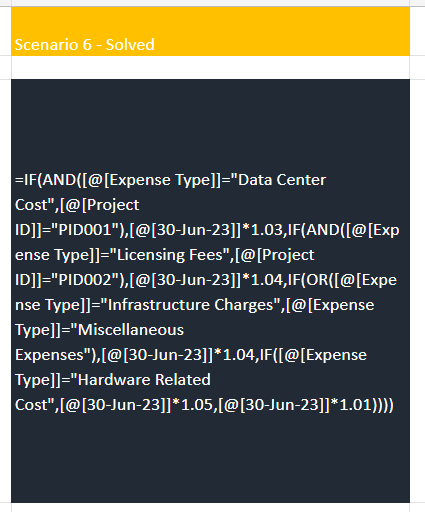
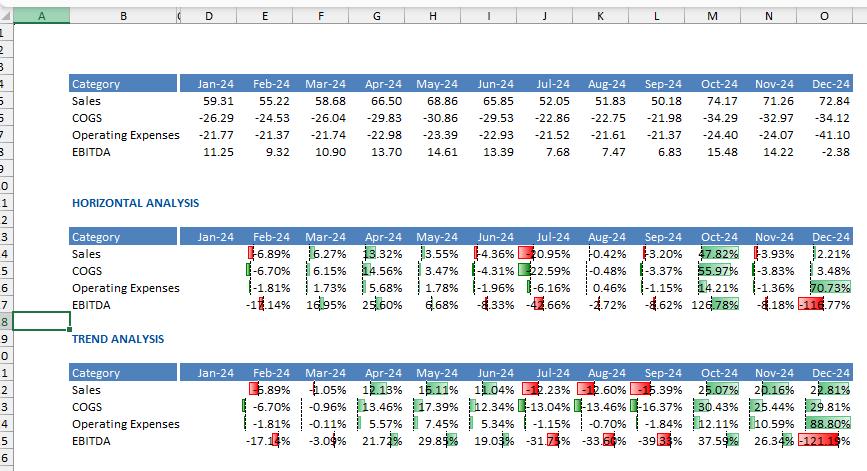
Practical, scenario-based learning. Watch how we solve real-world data problems using advanced logical functions.
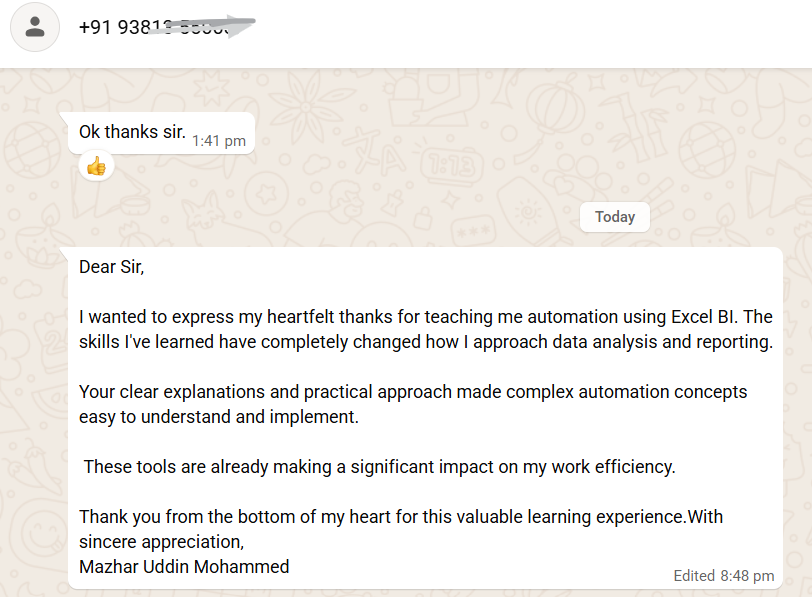
Unedited. Straight from WhatsApp.
np. how is it going so far with the course?
Excellent sir your teaching style is so good
I can easily understand everything
So glad to hear that dear 😊
Sir please keep it up and make new courses and projects for us
I am very eager to learn from you more
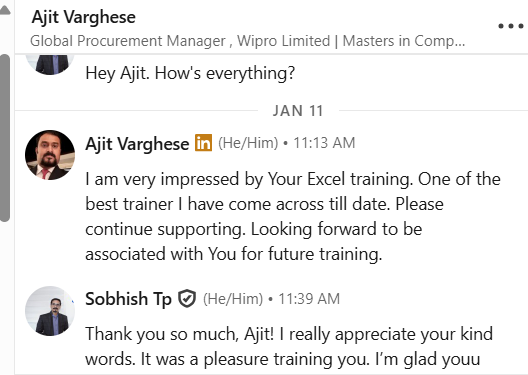
"Your teaching style is so good.
I can easily understand everything."
Why this matters to you
Worried the content will be too technical?
AFAP is built for Finance & FP&A professionals — not IT developers. Every concept is taught with real MNC datasets in plain finance language.
Real feedback from Finance & Ops professionals across India.
"Before this course I was spending 4–5 hours every month just preparing the same MIS report. After Level 5, I automated the entire thing. It now runs in 10 minutes. I am genuinely impressed"
"I've done many Excel courses — free and paid. SOBH's Excel is different. It truly challenges you with analyst-level problem solving. I finally feel confident walking into interviews."
"Sobhish teaches from real experience, not just theory. The way he explains Power Query and DAX for Finance — I hadn't seen this anywhere else."
"Every project uses real Finance data. I could apply what I learned directly at work the next week. No other course has done that for me."
Your transformation story starts with one decision today.
Enroll NowEverything you need to know before joining.
Enroll now to get lifetime access to the full 180+ module curriculum.
 Launch your Graphy
.jpg)